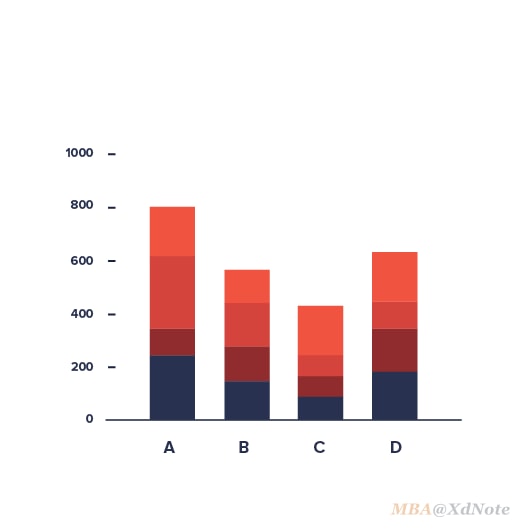
堆叠条形图.
Stacked Bar Chart
堆叠条形图相对于 条形图,可以使用 多个分段来代表不同的维度,提供了更为复杂的比较功能。
01何时使用
- 适合用来显示大型类别如何细分为较小的类别,以及每部分与总量有什么关系,根据堆叠方式来看,可以分为两种:
- 适合用来 比较每个分组的总量。
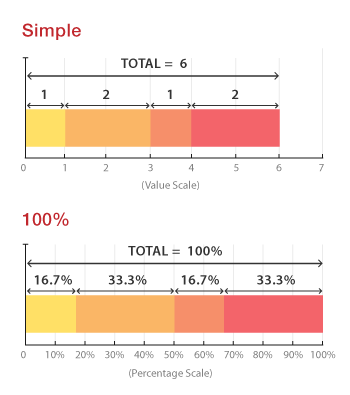
- 100% 堆叠式条形图会显示每组占总体的百分比,并按该组每个数值占整体的百分比来绘制,可用来显示每组中数量之间的相对差异。
堆叠条形图的一个主要缺点:条形分段越多,图表就越难以阅读。另外,较难比较不同分段,因为它们不在同一基线之上。
基础图形的变体
简单分类
适合用来显示大型类别如何细分为较小的类别,以及每部分与总量有什么关系,根据堆叠方式来看,可以分为两种:
- 简单堆叠式条形图将分段数值一个接一个地放置。条形的总值就是所有段值加在一起。适合用来 比较每个分组的总量。
- 100% 堆叠式条形图会显示每组占总体的百分比,并按该组每个数值占整体的百分比来绘制,可用来显示每组中数量之间的相对差异。
02建议与注意
常见的基础图形通俗易懂,随处可见,有时会稍加修改而产生新的变体。 有时传达的数据会做出删减,或是特殊装饰一下来消灭审美疲劳。
03工具代码
04相关文章
- 制作堆叠柱状图时需要注意什么?
- Kosara, R. (2016). Stacked Bars Are the Worst.
- Acampora, J. (2013). Stacked Column Bar Chart Alternatives – Find the Missing Trends . :.
- wtf-viz. (n.d.). math enrolments drop to lowest rate in 50 years.
- Yee, J. (2018). Billboard Music Evolution | Data Visualisation.
- ferdio. (2018). Flag Stories.
- Howcolour. (2018). stacked column icon.
- Stevens, H. and Aggarwal, P. (2017). What’s it like to get trolled all day long?.
- Stiles, M. (2012). Charting U.S. Gun Manufacturing.
- mongoDB team. (n.d.). Column and Bar Charts.
- ExtendOffice. (n.d.). How To Create Stacked Bar/Column Chart In Excel?.
- Excel (A-Z). (2016). How to Create Stacked Bar Chart in Power BI Desktop.
- Tableau Help. (2013). 使用多个度量创建堆叠条形图.
- Agarrwal, A. (2013). QlikView Tutorials | Stacked Bar Chart | Data and Tools.
- Echarts team. (n.d.). 堆叠柱状图. .26 January 2019].
- AntV team. (n.d.). 堆叠柱状图.
- Bostock, M. (2018). D3 Stacked Bar Chart.
- matplotlib team. (n.d.). Stacked Bar Graph.
- Catalpa, J., Zrenchik, K. and Yang, Y. (n.d.). How to Make a Stacked Bar Chart in R Using ggplot2.
- Rost, L.C. (2018) .What to consider when creating stacked column charts.
- Scarr, S. (2015). Iraq's bloody toll.