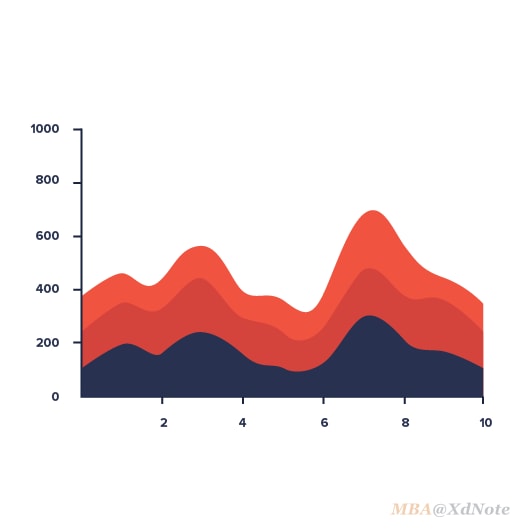
堆叠面积图.
Stacked Area Chart
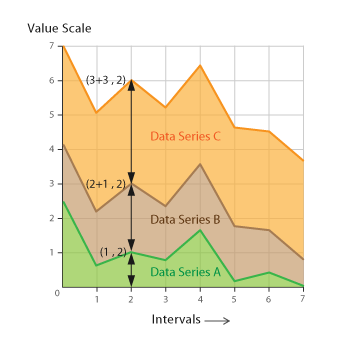
堆积面积图是对 面积图 的扩展,使用多个数据维度,这些数据系列从上一个系列留下的点开始每个点。对于比较在间隔内变化的多个变量很有用。
堆叠面积图上的最大的面积代表了所有的数据量的总和,各个叠起来的面积 表示 各个数据量的大小。
在堆叠面积图的基础之上,将各个面积的因变量的数据使用加和后的总量进行归一化就形成了百分比堆叠面积图。
基础图形的变体
组成成分
- X 轴通常是时间,或是连续变化的量
- Y 轴可以是数量,或成分占数据的百分比。
- 不同的系列以面积图的形式表示,堆叠在一起(不交差)
01建议与注意
常见的基础图形通俗易懂,随处可见,有时会稍加修改而产生新的变体。 有时传达的数据会做出删减,或是特殊装饰一下来消灭审美疲劳。
02工具代码
- AnyChart
- amCharts
- Infogram
- JSCharting
- OnlineChartTool
- Python Graph Gallery
- Vega
- ZingChart
- ZoomCharts
- Yearly Energy Production - FusionCharts
- Stacked Area Chart - AnyChart
- 堆叠面积图 (Excel)
- 教程 (Excel)
- 复刻设计案例3:堆积的面积图+百分比柱形图 (Excel)
- 堆叠面积图 (Power BI)
- 堆叠面积图 (Tableau)
- 官方实例 (ECharts)
- 官方实例 (AntV)
- 堆叠面积图 (D3)
- 堆叠面积图 (D3)
- 官方demo (matplotlib)
- 示例及代码 (matplotlib)
- 示例及代码 (ggplot2)
03相关文章
- I hate stacked area charts-堆叠面积图的缺点。
- Effective Use of Area Charts-如何有效的使用面积图。
- AntV墨者学院. (n.d.). 堆叠面积图.
- AnyChart. (n.d.). Stacked Area Chart.
- AnyChart. (n.d.). Percent Stacked Area Chart.
- 镝次元数据传媒实验室. (2017). 堆积图表界的翘楚!河流图如何搞定“巨量”数据 |图表家族#34 .
- The Economist. (2019). Knife-crime in Britain is rising almost everywhere.
- The Economist. (2018). Reductions in childhood mortality have prevented 100m deaths since 1990.
- 刘万祥ExcelPro. (2017). 一图两用:堆积的面积图+百分比柱形图.
- VISUAL CAPITALIST. (2018). Visualizing 40 Years of Music Industry Sales.
- Mark-Jan Werner. (2015). there's a lot of debt.
- The Economist. (2016). Labour-market woes.
- Excel (A-Z) (2016). How to Create 2D Stacked Area Chart in MS Excel 2013.
- Trumpexcel, D. (n.d.). How to Create an Area Chart in Excel (explained with Examples)?.
- laximi skills (2018). How to create Stacked area chart in power bi desktop || laxmi skills power bi desktop part (16).
- Agarrwal, A. (2018). Tableau Tutorial 22 | How to Create Area Chart in Tableau | Tableau Area Chart.
- Echarts team. (n.d.). 堆叠面积图.
- AntV team. (n.d.). 堆叠面积图.
- Bostock, M. (2018). D3 Stacked Area Chart Example.
- Bostock, M. (2018). D3 Stacked Area Chart.
- Matplotlib team. (n.d.). 堆叠面积图.
- THE PYTHON GRAPH GALLERY team. (n.d.). STACKED AREA PLOT.
- THE R GRAPH GALLERY team. (n.d.). 堆叠面积图.
- Dr. Drang. (2011). I hate stacked area charts.