螺旋热图.
Spiral Heat Map
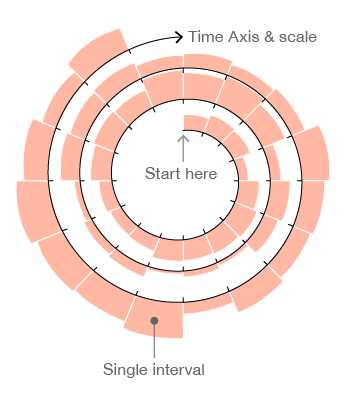
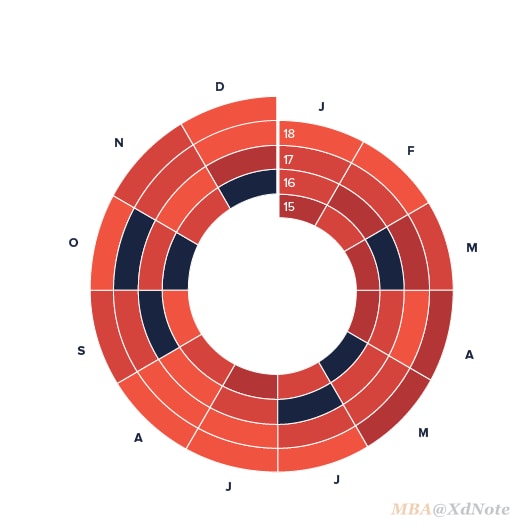
螺旋热图是一种特定类型的 热图,专为连续的可比较周期(如年或天)而设计。
01何时使用
- 和热图相比,螺旋热图可以展示大量的数据,而且会把同条数据在多个周期的不同热图自动归结到同一条半径或同一个扇区内,非常适合做比较。
和热图相比,螺旋热图可以展示大量的数据,而且会把同条数据在多个周期的不同热图自动归结到同一条半径或同一个扇区内,非常适合做比较。
特殊的时间可视化
02建议与注意
对于时间数据来说,最常见的可视化方法就是折线图。但是,由于时间数据太过常见,每行业都有其独特性。 对于一些特殊的数据,就可以通过一些特别的方法,让信息更好的传达。