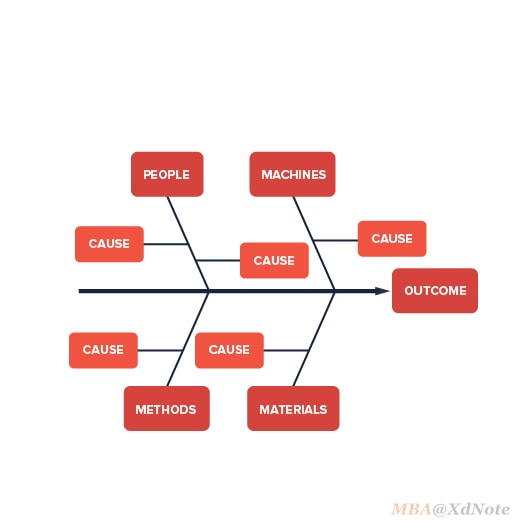
鱼骨图.
Fishbone Diagram
鱼骨图(Fishbone Diagram) 又称石川图(英语:Ishikawa Diagram),因果图、关键要因图、要因分析图,它常用于产品设计,来显示某个总体效果的可能因子,从而找到 问题的原因。
01何时使用
- 测(测量/检查,Measurement/ Inspection):在此制作过程所产生,用来检查品质的资料,也包括测量用的
思维工具
和普通的可视化不同,思维工具更注重通过可视化的手段来 做性质的界定 ,而不是数量的展示。
在个人思考/商务决策,可视化可作为工作帮助梳理想法,理清头绪。
组成成分
- 鱼头的右边,是待分析的 问题。
- 潜在因素分为 几个大类,在问题的的左边。
- 大类因素中,还可以生出 小类因素,与所属大类因素的支线相边。
附:制造品质管理因素(5M1E)
- 人(Man):和此一制程有关的所有人员。
- 机(机器,Machine):进行此制程需要的设备、电脑等相关工具。
- 物(物料,Material):生产成品需要的原材料、零件、纸、笔等物品。
- 法(方法,Method):制程进行的方式,以及进行时需要的特定需求,像是政策、程序、规定、标准及法规等。
- 环(环境/媒介,Environment/ Medium):制程运作时的条件,例如地点、时点、温度、湿度或是文化等。
- 测(测量/检查,Measurement/ Inspection):在此制作过程所产生,用来检查品质的资料,也包括测量用的
02建议与注意
现代管理学先驱日本学者 石川馨 在川崎重工船厂创建品质管制过程时发明石川图,于1956年发表的著作《品质管理入门》创立的因果模型图,现在已经成为品质管理的七种基本工具之一,识别造成问题的所有潜在因素。