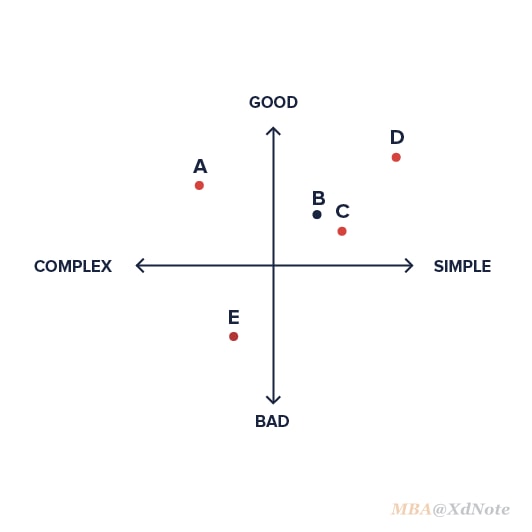
Opposite Diagram
相反的图表可以用笛卡尔坐标在水平轴和垂直轴上显示两组对立面。
数据或项目被显示为点的集合,每个点具有确定在水平轴上的位置的两个变量的值和确定在垂直轴上的位置的另一个变量的值。在很多方面,它与美国的散布图相似。
这些值可以是数据驱动的,但它通常用于概念目的,方法是在相对比例上显示问题的对立面。
Page not found | IIT Institute of Design | IIT Institute of Design
Visual thinking landscape | What is visual thinking good for… | Flickr
Visually Analysing the Creative Community on Behance
ferdio
Book Excerpt: The User Experience Team of One | UX Magazine
101 Design Methods
How Conservative A Supreme Court Nominee Can Trump Get Through The Senate? | FiveThirtyEight
innovation-map-incremental-evolutionary-diagram | Plan a Pip… | Flickr