§数据流动可视化系列
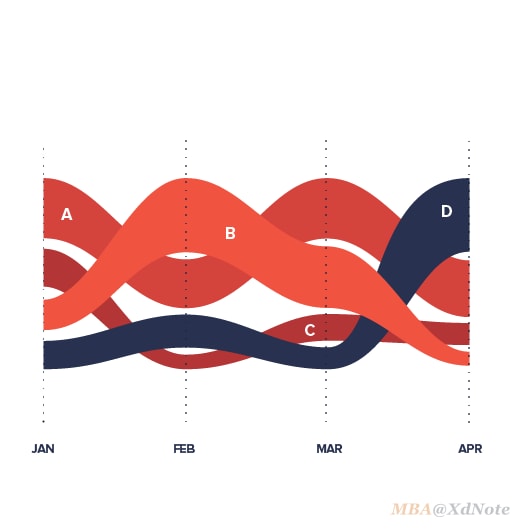
Sorted Stream Graph
和 流图 一样,但排序流图是围绕中心轴偏移的面积图,从而形成流动的有机形状。
与流图的主要区别是以排序非堆叠的方式展示数据。
数据在不同的阶段产生了结构性的变化时,通过可视化手段看数据成分的变动大小及变动方向。 在专业的数据分析,及商业应用中经常会用到。
Three maps and three misunderstandings: A digital mapping of climate diplomacy - Tommaso Venturini, Nicolas Baya Laffite, Jean-Philippe Cointet, Ian Gray, Vinciane Zabban, Kari De Pryck, 2014
File:DensityDesign Research Lab - Dipartimento INDACO - Politecnico di Milano, Share Your Knowledge 2011 - 1.jpg - Wikimedia Commons
All sizes | Corriere della Sera - La Lettura - New Languages #22 | Flickr - Photo Sharing!
Improving visualisation - Stream graph variation
100 MOST VALUABLE BRANDS 2010/15 - Corriere della Sera on Behance
WIRED UK - Infoporn - Murderous Measurements on Behance
AFRICA - Big Change / Big Chance - Triennale di Milano on Behance
How Does Your Car Stack Up for Safety? | Title Pro Loans