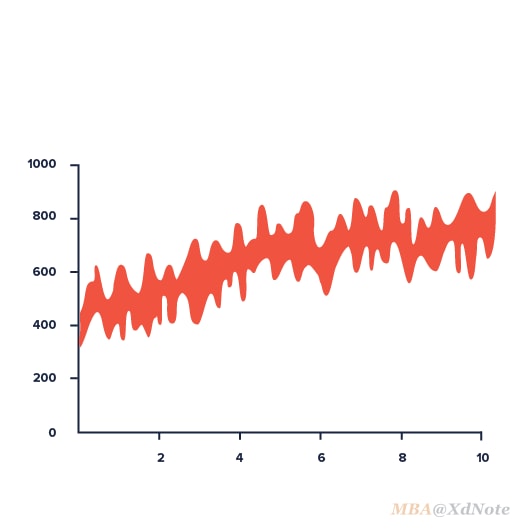
Range Area Chart
范围面积图类似于面积图。这两种图表类型之间的主要区别在于,在范围面积图表中,颜色填充在低值和高值之间的区域。
范围面积图类型的数据可视化主要用于同时显示给定时间段内的高值和低值。X轴通常表示显示数据随时间变化的时间刻度。
Hot spots far and near on Behance
How Nonemployed Americans Spend Their Weekdays: Men vs. Women - The New York Times
A Long View of the World Economy, Year 1 to Year 2050 - Bogleheads.org