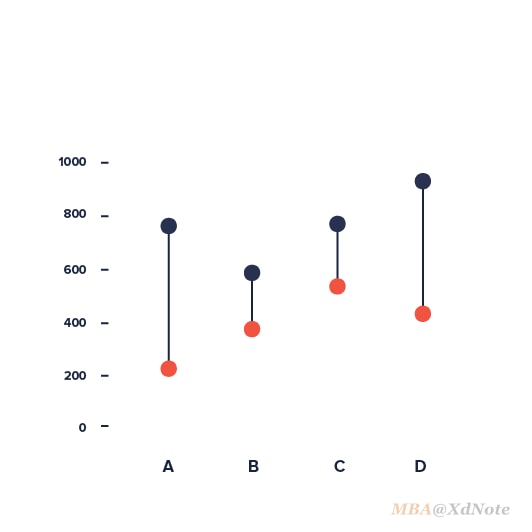
Dumbbell Plot
哑铃图是一个可视化图形,它显示了数据中两个点之间的变化。它因哑铃形状而得名。非常适合显示两个时间点、两个条件或两个组之间的差异。
∅ 暂无描述
State of the State | Visual Cinnamon
Gender Pay Gap — Information is Beautiful
The Weight of the World on Behance
dataviz Weather Eindhoven 2014 on Behance
Rich and poor teenagers use the web differently – here's what this is doing to inequality | World Economic Forum
The World's Top Cities for People and the Planet